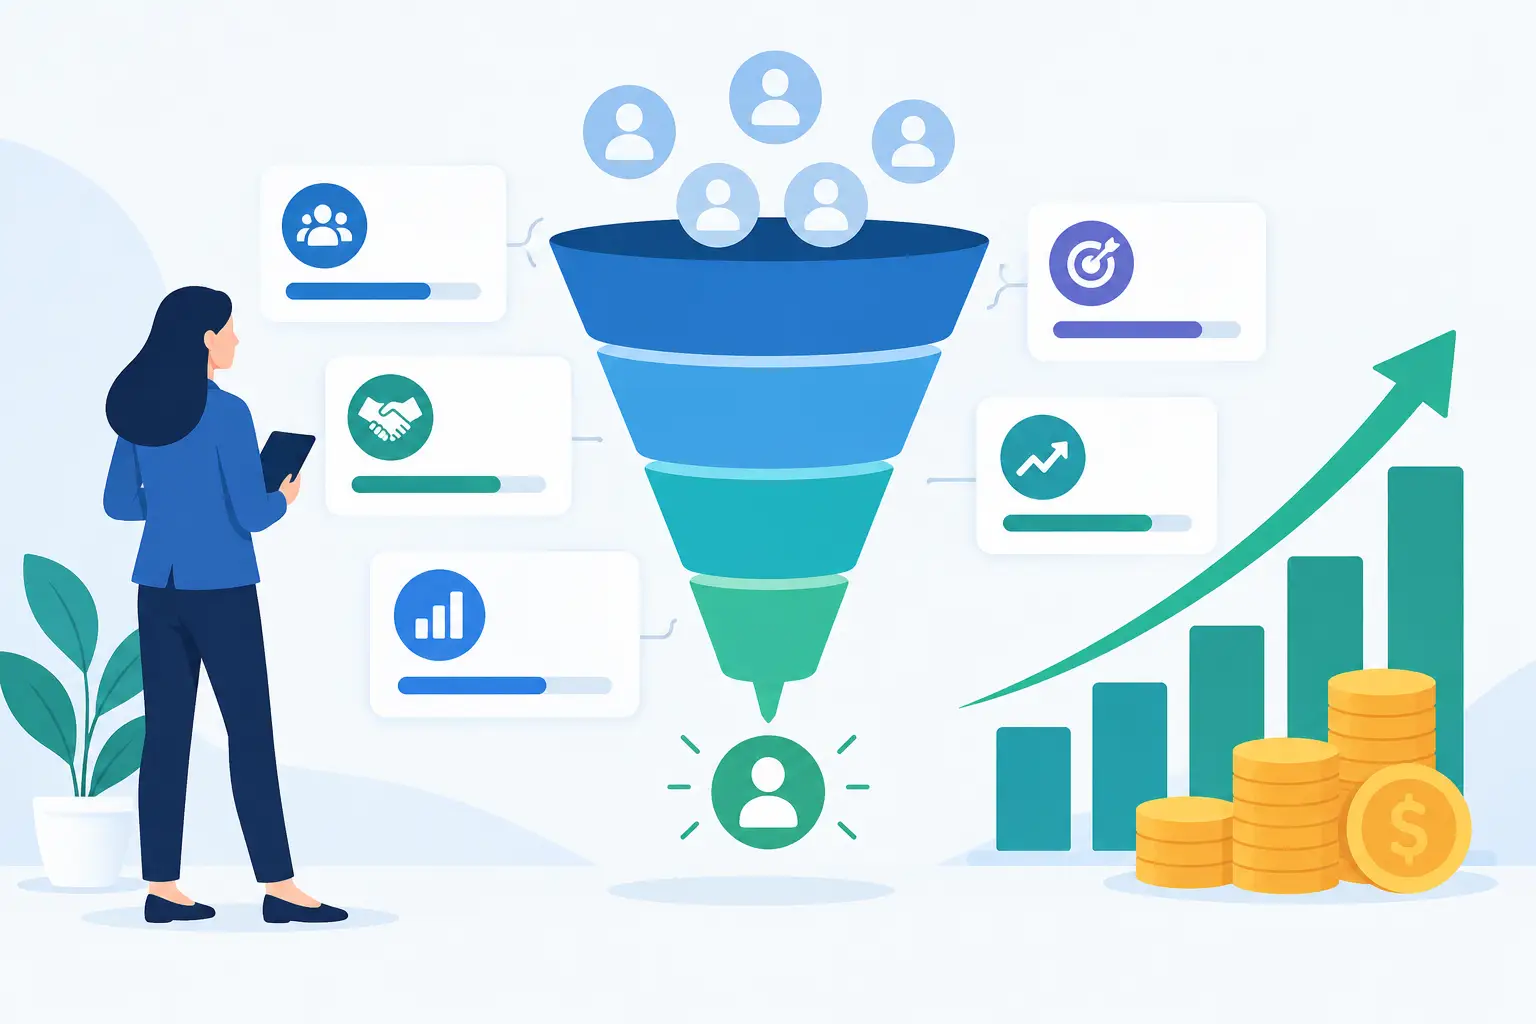
A full calendar can hide a weak pipeline. If sales reps are taking meetings with poor-fit companies, chasing inactive prospects, or receiving leads with no clear buying signal, activity rises while revenue stalls. The right sales pipeline KPIs expose that problem early, before a quarterly miss becomes unavoidable.
For B2B sales leaders, pipeline reporting is not about producing more dashboards. It is about knowing whether your top-of-funnel engine is creating real opportunities, whether your sales process is moving buyers forward, and where revenue is leaking out. The metrics below create that visibility.
Start With the Pipeline Metrics That Affect Revenue
The best sales pipeline KPIs connect directly to a commercial decision. They tell you whether to adjust targeting, improve qualification, coach discovery calls, increase follow-up, or change forecast expectations.
A common mistake is measuring every available CRM field and treating volume as progress. More leads, more emails, and more meetings can look positive while conversion rates fall. A smaller number of meetings with in-market accounts can generate more pipeline and lower acquisition costs than a large campaign built around broad job-title targeting.
Your KPI set should therefore measure four things: pipeline coverage, conversion efficiency, deal velocity, and lead quality. These metrics work together. No single number can explain pipeline health on its own.
1. Pipeline Coverage Ratio
Pipeline coverage compares the value of qualified pipeline against the revenue target for a period. If your quarterly target is $1 million and you have $3 million in qualified pipeline, your coverage ratio is 3x.
The right target depends on average win rate, sales cycle length, deal size, and how much late-stage pipeline is already validated. A team with a 25% win rate generally needs more coverage than a team converting 40% of qualified opportunities. A 3x target is often a starting point, not a universal rule.
The key word is qualified. Including early conversations, unverified inbound inquiries, or opportunities without a confirmed problem inflates coverage and creates false confidence. Define the stage at which an opportunity counts, then apply that definition consistently.
2. Lead-to-Meeting Conversion Rate
This metric shows how effectively your prospecting channels turn targeted leads into booked conversations. Calculate it by dividing qualified meetings booked by leads contacted or leads accepted, depending on how your process is structured.
A low rate may point to weak list quality, generic messaging, the wrong personas, poor timing, or an offer that does not earn attention. It does not automatically mean your outreach team is underperforming. Before changing scripts or increasing volume, review whether the campaign is aimed at accounts that match your ideal customer profile and show credible buying signals.
For outsourced sales development and multichannel outreach, track this rate by vertical, campaign, persona, and source. A campaign aimed at IT leaders in healthcare may behave very differently from one targeting operations leaders in logistics. Blending them into a single average makes optimization harder.
3. Meeting-to-Opportunity Conversion Rate
Booked meetings matter only if they create legitimate sales opportunities. Meeting-to-opportunity conversion is one of the clearest measures of appointment quality and sales-development alignment.
If meetings are plentiful but few become opportunities, the issue is usually upstream. Qualification criteria may be too loose, campaigns may be reaching researchers rather than decision-makers, or the handoff may fail to give account executives the context they need. Sales teams should document why meetings are disqualified instead of labeling them simply as “bad leads.”
Review the loss reasons in detail. Was there no defined need, no budget path, no urgency, poor account fit, or no access to the buying committee? Those answers tell your prospecting team what to filter out and what to prioritize.
4. Opportunity-to-Win Rate
Win rate measures the percentage of qualified opportunities that become closed-won deals. It is a core forecast metric, but it also acts as a quality control signal for the entire pipeline engine.
A falling win rate can mean positioning no longer matches market needs, competitors are winning more often, pricing has become a barrier, or opportunities are being created too early. It can also reveal a mismatch between marketing or outbound promises and the sales conversation that follows.
Segment the metric by source. Compare inbound, referral, paid, webinar, and outbound-sourced opportunities. Do not assume one channel is better because it produces more opportunities. The channel that produces fewer deals but a substantially higher win rate and larger contract value may be more valuable to scale.
5. Sales Cycle Length and Stage Velocity
Sales cycle length tracks the time from opportunity creation to closed-won or closed-lost. Stage velocity goes deeper by showing how long deals remain in each stage.
Overall cycle length helps with capacity planning and forecasting. Stage velocity tells you where deals are getting stuck. If prospects move quickly from discovery to proposal but remain in proposal for 45 days, the bottleneck may be procurement, pricing, stakeholder alignment, or weak mutual action plans.
Do not treat every slow deal as a sales failure. Enterprise accounts often need longer buying cycles, particularly in financial services and healthcare. The better benchmark is cycle length by deal type, company size, industry, and source. A meaningful deviation from the normal range deserves attention.
6. Pipeline Aging
Pipeline aging measures how long opportunities have remained open compared with the expected cycle for their stage. It is one of the most practical sales pipeline KPIs because stale deals quietly distort forecasts.
An opportunity sitting in discovery for twice the normal duration is not merely “still working.” It needs a documented next step, a clear reason for the delay, and an objective assessment of whether it should remain open. Without that discipline, reps may hold deals in the pipeline to protect perceived coverage.
Set aging alerts in your CRM and require a review when opportunities pass stage-specific thresholds. The action may be to re-engage, move the opportunity backward, adjust the close date, or close it out. Cleaning the pipeline is not negative. It improves forecast accuracy and focuses sales time on deals that can move.
7. Average Deal Size and Pipeline Value
Average deal size shows whether the team is attracting the accounts and use cases that support growth targets. Track both average contract value and total pipeline value, but avoid relying on averages alone. A few unusually large opportunities can create a misleading picture.
Use median deal size alongside the average, and segment by acquisition source. If one source consistently produces deals below your minimum viable contract value, it may still have a role in the mix, but only if acquisition cost and delivery economics support it.
For growth-focused firms, this KPI also informs account selection. Better targeting should not only create more meetings. It should create conversations with companies that have the need, scale, and commercial potential to become worthwhile customers.
8. Lead Response Time and Follow-Up Coverage
Speed matters most when intent is high. Lead response time tracks how quickly a rep or SDR makes the first meaningful contact after a lead engages, requests information, attends a webinar, or is identified through a relevant intent signal.
Follow-up coverage measures whether leads receive the planned number of touches across email, phone, LinkedIn, and other approved channels. A fast first response followed by one unanswered email is not a process. Consistent follow-up is where many pipeline opportunities are won or lost.
These KPIs require clear ownership. If marketing generates interest, sales development qualifies it, and account executives run discovery, everyone needs visibility into the handoff and the service-level expectations. CRM integration is essential here because fragmented systems create gaps that prospects experience as silence.
Build a KPI Review That Produces Action
A weekly pipeline review should be short, factual, and focused on exceptions. Start with coverage against target, then examine conversion changes, aging opportunities, stage bottlenecks, and source-level quality. The goal is not to interrogate reps about every deal. It is to identify the operational change most likely to improve pipeline performance.
When booked meetings are high but opportunity creation is low, tighten targeting and qualification. When opportunity volume is healthy but deals stall, examine sales process, stakeholder access, and next-step discipline. When win rates decline, review positioning, competition, and the types of accounts entering the pipeline.
Appointment Gurus helps B2B teams create more control at the top of the funnel by combining industry-specific targeting, intent data, managed outreach, and CRM-connected reporting. The right partner should be measured by qualified opportunities and pipeline contribution, not activity volume alone.
Treat your KPIs as operating signals, not a monthly report card. When every metric has an owner, a definition, and a next action, your pipeline becomes easier to forecast and far harder to leave to chance.